AWS News Blog
New – Amazon DevOps Guru for RDS to Detect, Diagnose, and Resolve Amazon Aurora-Related Issues using ML
|
|
Today we are announcing Amazon DevOps Guru for RDS, a new capability for Amazon DevOps Guru. It allows developers to easily detect, diagnose, and resolve performance and operational issues in Amazon Aurora.
Hundreds of thousands of customers nowadays are using Amazon Aurora because it is highly available, scalable, and durable. But as applications grow in size and complexity, it becomes more challenging for these customers to detect and resolve operational and performance issues quickly.
During last year’s re:Invent, we announced DevOps Guru, a service that uses machine learning (ML) to automatically detect and alert customers of application issues, including database problems. Today we are announcing DevOps Guru for RDS to help developers using Amazon Aurora databases to detect, diagnose, and resolve database performance issues fast and at scale. Now developers will have enough information to determine the exact cause for a database performance issue. This launch will save developers and engineers many hours of work trying to uncover and remediate the performance-related database issues.
DevOps Guru for RDS uses ML to automatically identify and analyze a wide range of performance-related database issues, such as over-utilization of host resources, database bottlenecks, or misbehavior of SQL queries. It also recommends solutions to remediate the issues it finds. To use this capability, you don’t need to be a database or ML expert.
When an issue is detected, DevOps Guru for RDS displays the finding in the DevOps Guru console and sends notifications using Amazon EventBridge or Amazon Simple Notification Service (Amazon SNS). This allows developers to automatically manage and take real-time action on the issues.
How DevOps Guru for RDS Works
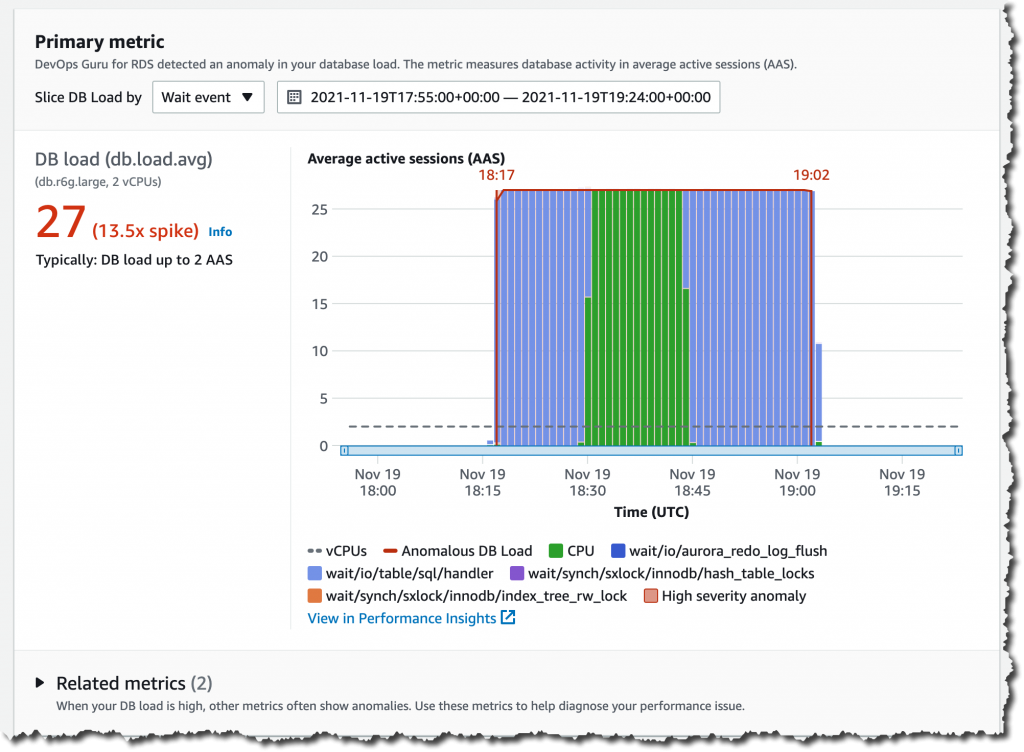
DevOps Guru for RDS uses anomaly detection on the database load (DB load) performance metric to detect issues. DB load is measured in units of Average Active Sessions (AAS). DB load measures the level of activity in your database, making it a great metric to understand the health of your database. If the DB load is high, this can result in performance issues. This metric can be compared to the number of virtual CPUs (vCPUs), and if the DB load is higher than that number, issues can arise.
The most useful dimensions for this metric are the wait events and the top SQL. The wait event describes what the system conditions that are currently running SQLs are waiting on. The most common reasons why a statement is waiting is that it is waiting for the CPU, waiting for a read or write, or waiting for a locked resource. The top SQL dimension shows which queries are contributing the most to DB load.
The following image is an example of a finding that DevOps Guru for RDS reported. The graph shows that from the AAS, most of them were waiting for access to a table or for CPU.

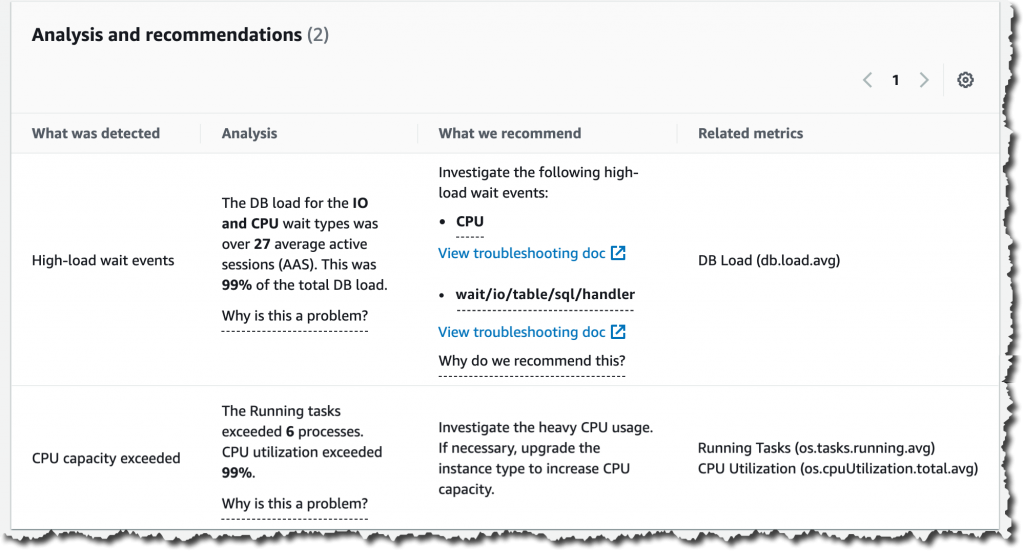
If you continue scrolling on the DevOps Guru for RDS analysis page, you can discover the cause for the problem and some recommendations to fix it. In this particular example, two problems were detected: high-load wait events and CPU capacity exceeded.
DevOps Guru for RDS looks more in-depth into these problems. First, it looks at the high-load wait events, where there were 27 AAS for the IO and CPU wait types, which is 99 percent of the total DB load.
Second, it tells us that the running tasks exceeded six processes. This database only has two vCPUs, and the recommended number of running processes should be a maximum of four (2x vCPUs). DevOps Guru for RDS also makes recommendations to fix these issues.
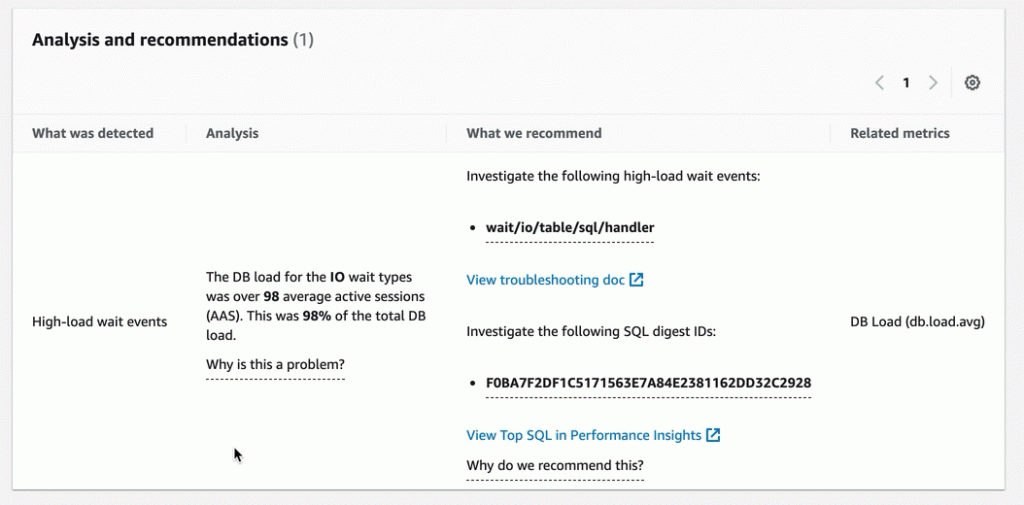
In another anomaly, the graph shows that there was a high load of wait events, and one SQL query was found to require further investigation. You can even see the exact SQL query if you click on the SQL digest IDs. The insight’s analysis and recommendation section is full of information on how to investigate further and fix the issue. You can get a lot of detailed information by clicking on the wait event, for example, on the wait event wait/io/table/sql/handler or in the View troubleshooting doc link.
Get started with DevOps Guru for RDS
To get started with this new capability of DevOps Guru, make sure that Performance Insights is enabled for your Amazon Aurora DB instances. It supports Amazon Aurora with MySQL- and PostgreSQL-compatibility. For instructions on how to enable Performance Insights, see Enabling and disabling Performance Insights.
The next step is to enable DevOps Guru to start monitoring your AWS resources. You can specify the resources you want to be covered by DevOps Guru.
If you are already using DevOps Guru, whenever there is a new insight for an Amazon Aurora database resource, you will see it in the console.
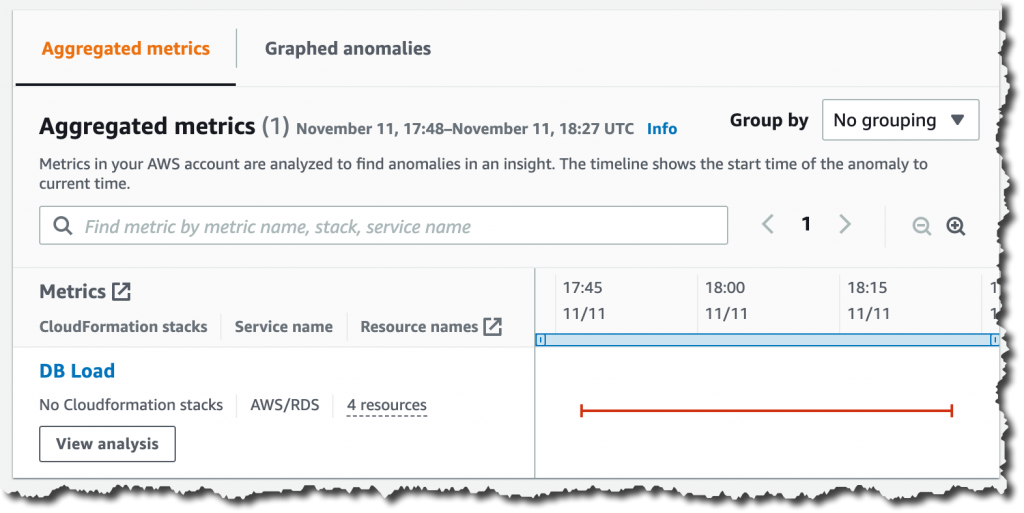
To see the detailed database analysis, navigate to the Insight page and select the new View analysis button under the DB load aggregated metric. That button will take you to the detailed analysis by DevOps Guru for RDS.
Pricing and Availability
DevOps Guru for RDS is offered to customers at no additional charge, as part of the existing price that DevOps Guru charges customers for RDS resources.
DevOps Guru for RDS is available in all Regions where DevOps Guru is available, US East (Ohio), US East (N. Virginia), US West (Oregon), Asia Pacific (Singapore), Asia Pacific (Sydney), Asia Pacific (Tokyo), Europe (Frankfurt), Europe (Ireland), and Europe (Stockholm).
Learn more about DevOps Guru for RDS and check out the talk at AWS re:Invent “Automatically detect and resolve performance issues with Amazon DevOps Guru for RDS” (Session Id 15877).
— Marcia


